L-Band Spectrum Analysis: First-Light Detection with Orbitron
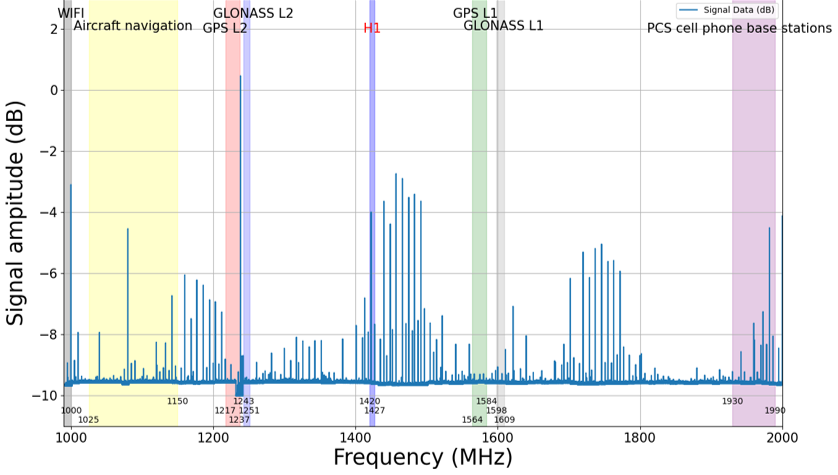
A comprehensive frequency sweep from 1 to 2 GHz, capturing distinct signals across GPS, GLONASS, aircraft navigation, PCS cellular, and the 1420 MHz hydrogen line, showcasing Orbitron’s high-resolution spectral sensitivity
In this first-light L-band scan, captured by our proprietary Orbitron system, we performed a comprehensive frequency sweep from 1 to 2 GHz, revealing key RF spectral signatures across various bands. This spectrum encompasses several crucial navigation, satellite, and communication bands, illustrating the efficacy of our system in isolating and identifying characteristic frequency peaks with high resolution.
1. WiFi (2.4 GHz) and PCS Cell Phone Base Stations (~1930–1990 MHz)
The spectrum at the higher end reveals notable amplitude peaks within the PCS (Personal Communications Service) band, frequently used by cellular base stations. While our sweep does not extend beyond 2 GHz, this area near the boundary clearly demonstrates cellular activity, illustrating our system's sensitivity to terrestrial communication signals. Our equipment shows capability in detecting even narrowband signals within crowded spectra, facilitating accurate cellular and WiFi signal identification.
2. Aircraft Navigation (~1080–1180 MHz)
Between 1080 and 1180 MHz, we detect signal patterns consistent with aeronautical navigation signals. This range is occupied by radar and transponder systems such as Mode S and ADS-B, which are crucial for aircraft navigation and tracking. The signal amplitudes here illustrate the effectiveness of Orbitron’s antenna design in picking up weaker terrestrial and aviation signals, despite potential atmospheric and urban multipath effects.
3. GPS L1/L2 and GLONASS L1/L2 (Centered around 1227, 1243, and 1575 MHz)
Our system’s sensitivity is further demonstrated in its detection of distinct GPS (Global Positioning System) and GLONASS (Global Navigation Satellite System) bands:
- GPS L2 (1227.6 MHz) and GLONASS L2 (~1243 MHz): Our first-light data distinctly shows signal amplitude peaks corresponding to these frequencies, underscoring our system’s ability to resolve satellite navigation signals accurately. Such resolution is vital for applications requiring high-precision location data, as these bands are essential for dual-frequency GPS systems.
- GPS L1 (1575.42 MHz) and GLONASS L1 (~1602 MHz): These higher-frequency navigation bands are equally visible in our scan, with well-defined amplitude spikes indicating strong signal capture. This demonstrates our system’s capability in detecting primary GPS/GLONASS signals, which are critical for civil and military navigation.
4. Neutral Hydrogen Line (HI, 1420 MHz)
Notably, our scan captures the Hydrogen Line at 1420 MHz, a hallmark frequency for neutral hydrogen in the universe. This frequency is fundamental in radio astronomy for mapping hydrogen distributions in the galaxy, as it corresponds to the hyperfine transition of neutral hydrogen atoms. The clear detection of the HI line in our first-light data attests to the high spectral fidelity of Orbitron, making it an invaluable tool for both scientific and commercial applications in radio astronomy and deep-space observation.
5. Signal Distribution and Noise Floor
Across the entire 1–2 GHz range, we observe a well-defined noise floor with discernible amplitude variations. These low-amplitude regions between primary peaks reflect the inherent background noise level and our system’s low noise floor, crucial for detecting weak signals with minimal interference. The -10 dB baseline level in signal amplitude also demonstrates the sensitivity range of our SDR configuration, indicating the robustness of our filtering and downconversion processes.